? legend
## Run the example in '?matplot' or the following:
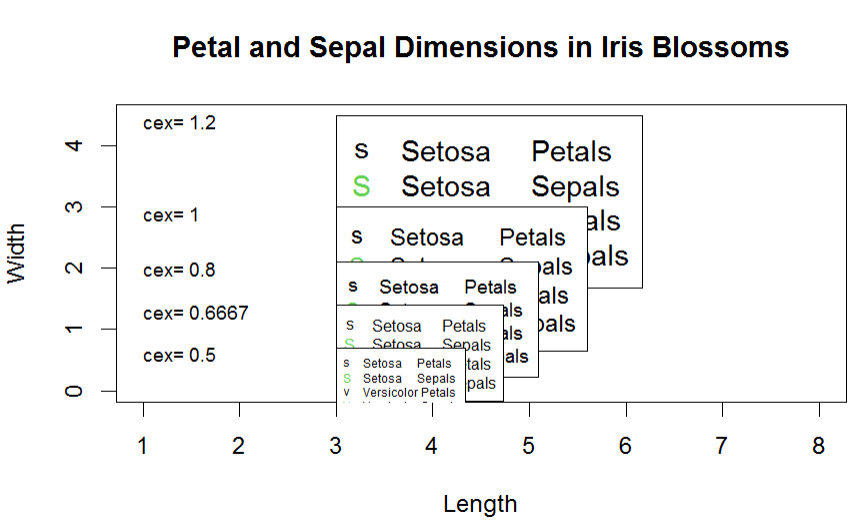
leg.txt <- c("Setosa Petals", "Setosa Sepals",
"Versicolor Petals", "Versicolor Sepals")
y.leg <- c(4.5, 3, 2.1, 1.4, .7)
cexv <- c(1.2, 1, 4/5, 2/3, 1/2)
matplot(c(1, 8), c(0, 4.5), type = "n", xlab = "Length", ylab = "Width",
main = "Petal and Sepal Dimensions in Iris Blossoms")
for (i in seq(cexv)) {
text (1, y.leg[i] - 0.1, paste("cex=", formatC(cexv[i])), cex = 0.8, adj = 0)
legend(3, y.leg[i], leg.txt, pch = "sSvV", col = c(1, 3), cex = cexv[i])
}